Saturday, 31 March 2012

Toyota

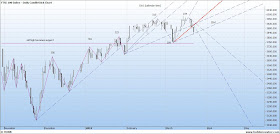
Looks to be losing momentum.The horizontal lines are 38 and 50% retracements.Does not inspire me with confidence that Japan may be starting a bull market.


AAPL

Apple formed a Doji on the weekly chart and a bearish Doji evening star on the daily.This chart is a square based on the current range (300 points) and 1 year from June 20 low.I marked in April 20 as price will equal time (300 degrees)The June - November low to low cycle also balances around then.


Friday, 30 March 2012

very putative 5 min count


The middle chart is the SPY,top one is Ftse,with 10,21,40 dma's Bottom chart is Ftse250.Moving aves show the  Ftse100 in a weaker position

AAPL

This run has lasted 18 weeks. 90 trading days is a cycle that can sometimes see a reversal


http://peterlbrandt.com/would-jesse-livermore-be-looking-to-go-short-apple/

Thursday, 29 March 2012

looks like we nailed BARC yesterday....down 4% today !


This setup I posted a couple of times recently is looking good.Seems to have a clear break down from the "rainbow"


Lumber

The bullish setup posted a few weeks ago seems to have failed


FTSE Lower high confirmed

We got nice follow through today,with a large black candle confirming the lower high


Here is the other Gann angle chart,with spaces left for holidays/weekends (ie calendar time)


and 2 charts from Investors Intelligence


Wednesday, 28 March 2012

30 year bond ,chart from Kimble


VED

Nice head and shoulders

 
There are fewer and fewer bears,with all the CB's liquidity floating all before it. Here is one http://sqwiitrader.com/free-daily-edition-for-28th-march-2012/
and a RUT chart from the post


More Fraud ?

http://www.youtube.com/watch?feature=player_embedded&v=pCfK8Hqb9Mc

Tuesday, 27 March 2012

SLW

Looking for a 3rd low here to buy.It may already be in  but safest to watch the 21 dma for a turn and price push above.Cycles show a clear 6 months down from April into October,next low probably next week (at 30 ?)


Charles Nenner

http://www.readtheticker.com/Pages/Blog1.aspx?65tf=486_charles-nenner-forbes-interview-march-2012-2012-03
http://english.caixin.com/2012-03-23/100372177_all.html

Andy Xie on the prospect of yen devaluation

Janet Tavakoli

Excellent video from Jesse's Cafe on endemic fraud and cover-ups in structured finance and derivatives
Janet asks "Whay aren't more people in jail?"

http://jessescrossroadscafe.blogspot.co.uk/2012/03/tavakkoli-on-ongoing-fraud-in-financial.html?utm_source=feedburner&utm_medium=feed&utm_campaign=Feed:+JessesCafeAmericain+%28Jesse%27s+Caf%C3%A9+Am%C3%A9ricain%29

Ftse

Ftse still looks much weaker than the SPX. Bears need to see this swing fail ,confirming the false break/double top pattern.The moving averages seem to be converging.


Monday, 26 March 2012

More James Grant

http://www.youtube.com/watch?v=JHiq3nb471U&feature=related
http://www.financialsense.com/financial-sense-newshour/guest-expert/2012/03/16/martin-armstrong/the-debt-crisis-will-rotate-from-europe-to-japan-to-us

Vedanta Resources

I think we decline into the cycle cluster although it may be a 5th wave up.Should know soon


Sunday, 25 March 2012

Wolseley


interesting to see how Gann's natural time dates operated on this 6 month rising wedge rally


and a FTSE chart from Sqwii


and S&P chart from Sqwii


http://smartmoneytracker.blogspot.co.uk/2012/03/can-bernanke-break-dollar-rally.html
I have mentioned Gann's concept of "natural time" often.The year is divided into fractions,with the 4 equinox and solstice dates being the main marker.Changes in trend are often seen around these dates.We may just have seen a 3rd successive low in gold on such a date.This chart from Kimble illustrates this principle in action


http://www.businessinsider.com/if-you-took-the-greed-out-of-wall-street-all-youd-have-left-is-pavement-why-greg-smiths-critique-is-way-too-narrow-2012-3?utm_source=readme&utm_medium=rightrail&utm_term=&utm_content=3&utm_campaign=recirc

Friday, 23 March 2012

Gold breaks up from declining wedge

This is Humblestudent's version of the wedge I have posted,with the breakout today
 http://humblestudent777.blogspot.co.uk/


Beans

this is not a forecast,just a look at measured moves and one possible scenario


AAPL

The first range up in a move can be used as a reference range. 3x the base will often mark a high,or at least resistance.


FTSE

FTSE broke the 10x1 line (coloured red) so is in a weak position now.We met a measured move target (wavers would say A=C) and got a false break (or Pinocchio) pattern which is effectively a double top.The Gann 90 day/ 900 point square also seems to have been effective.Lets see if the bear angles start to define a new downtrend.


Thursday, 22 March 2012

Dow 90 weeks,3600 points

The weekly fib counts are also interesting on this.The closing low in July 2010 was 9686 Add 3600= 13286.the low to high 44 week cycle is balanced by the 44 (actually 45) week time span to the recent high.So significant cycles are present but we need a reversal to confirm.