

Sunday, 31 July 2011


Dow failures
James Flanagan (at Gannglobal) has pointed out in the past that nearly important all trend reversals start with a false break pattern...


SPY square of range chart
This is an old chart first posted some months ago.
See how the 360 point range has called both highs ! First we measured 52 weeks from April 2010 high,then from July 2011 low (52 weeks=360 degrees,squaring the price range)

See how the 360 point range has called both highs ! First we measured 52 weeks from April 2010 high,then from July 2011 low (52 weeks=360 degrees,squaring the price range)

From Daniel Ferrera
http://www.sacredscience.com/ferrera/mathformula.htm
Jumping over to Gann’s Angle course, on the last page, GA-32, Gann says: “Figuring $100, or par, as a basis for stock prices and changing these prices to degrees, 12½ = 45-degrees, 25 = 90-degrees, 37½= 135-degrees, 50 = 180-degrees, 62½ = 225-degrees, 75 = 270-degrees, 82½ = 315-degrees, and 100 = 360”. This tiny little paragraph is the basis of the entire Murrey Math Trading Course, which readers of Traders World should be very familiar with since, T.H. Murrey has written numerous articles for the magazine. These numbers are all natural 8th numbers off of the base of 10, 100, 1000, 10000, 100000, etc. The part that is most confusing is balancing this with the time element, but based on the information given by Gann himself it should be obvious that he has already shown us part of the relationship. For example: If shares of XYZ stock moved up 12½ dollars in 45 days, weeks or 45 months then the stock is on the price degree of it’s time angle, that is to say that price and time are equal or balanced. Gann’s example: “When a stock sells at 50 on the 180th day, week or month, it is on the degree of its time angle”. “On February 1, 1915, U.S. Steel made a low at $38, which is closest to a price of $37½, which is 3/8th of 100 and equals 135-degree angle. Steel was 14 years or 168 months old on February 25, 1915, and hit the angle of 135-degrees, which showed that the price of Steel was behind time, but was in a strong position, holding at $38 above the 135-degree angle or the price $37½”. Just to make sure that you understand this information, U.S. Steel would have been balanced or “on the degree of its time angle” at a price of $46 5/8th because $100/ 360-degrees = 0.27777cents per degree and 168 months multiplied by 0.27777 = $46.67 which is closest to $46 or 5/8th in price. Therefore, Steel is $8 5/8th behind time. T.H. Murrey has his time rules based off the “Harvest Moon” but I would stick to W.D. Gann’s time definitions when using this natural 8th system and his plastic overlays as his method has a clear degree relationship to both price and time and also to the fractal structure, which he described in the quote mentioned above. I will discuss how to set up these charts properly in terms of time latter in the article with specific examples. Gann goes on to say: “When Steel reached $200, it equaled 2 circles of 360-degrees (two complete cycles of $100). When it advanced to $261¾, it was closest to $62½ (5/8th) in the third cycle of $100 or nearest the 225-degree angle or 5/8th point, which is the strongest angle after it crossed the half-way point at $250 or the 180-degree angle”.

Dow
This is the same chart but the top one has spaces for holidays and weekends ie it is based on calendar time.The angles are 1 x1 (not 2x1 as on chart annotation,my bad)


Saturday, 30 July 2011
Dow - 11250 target ?

The 50% retracement at 11245 seems a likely target. 7/8 of the high is 11265 and 11235 is the 1.618 expansion of the first range down.11232 is the target from range equality with the April-June decline last year.11209 is 7/6 x 9614. 6470 + 4800 . This might be the price target for the Aug 30 cycle date


S&P
I've tried to show how the cycles from the Gann emblem might fit in with retracements and channels.Not making any forecasts about where price will terminate the cycle ie future dates are not price forecasts but time forecasts


The 10,20 and 50 dema alignment looks very bearish.Short-term a bounce looks possible off the 3 month cycle,the 200 dma and 1270-80 support.The triple top in a LH position has crash potential so bounce is for selling !


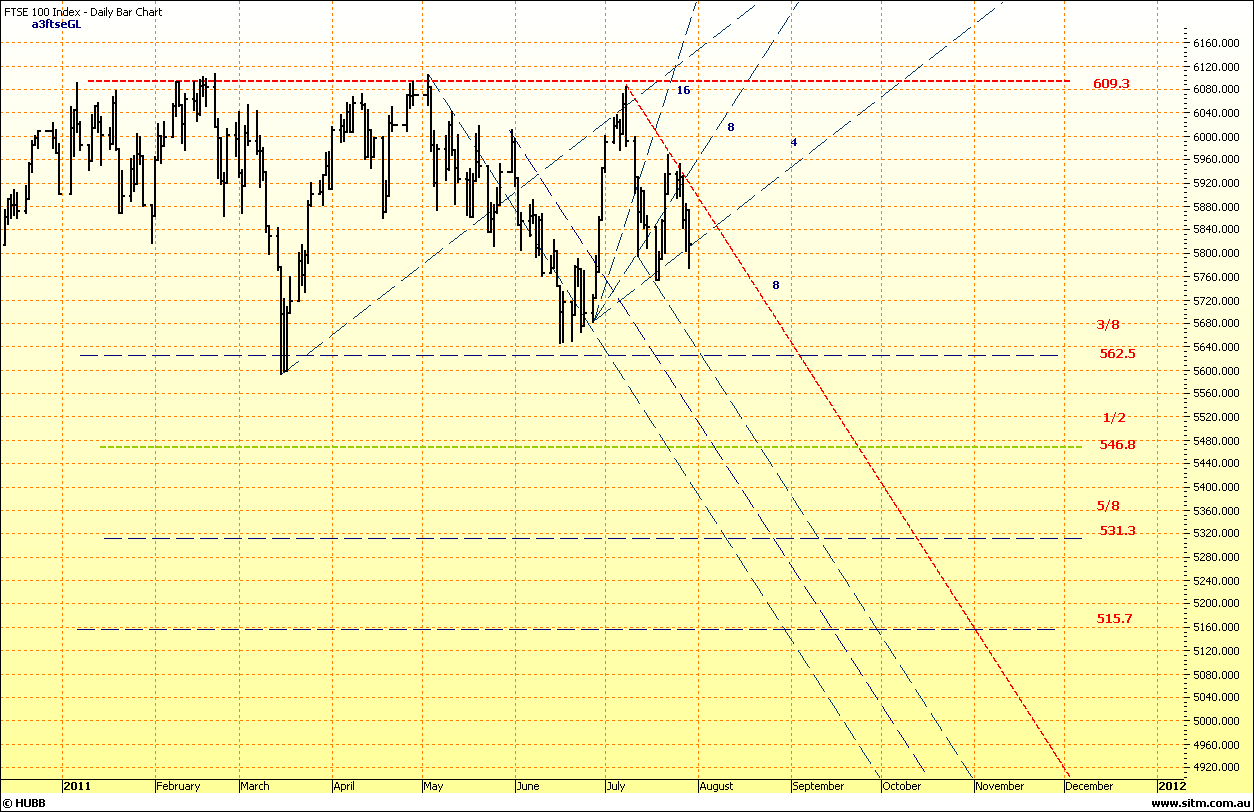
Ftse Monthly
3 resistance levels clustered together.I could have added a 4th one,6055 which is 75% from the low
I do believe the top is in now and these levels should hold

I do believe the top is in now and these levels should hold

Friday, 29 July 2011


Subscribe to:
Posts (Atom)


