Friday, 30 April 2010
Thursday, 29 April 2010
Wednesday, 28 April 2010
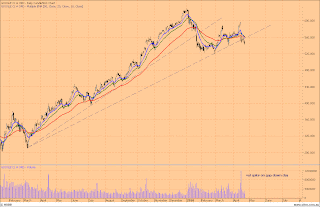
FTSE100 Top in ?
Tuesday, 27 April 2010
Ftse250


I got bearish on this far too early,given the poor economic outlook for the UK economy economy I expected the rally to fail around 50 to 61.8% of the previous range .However now we have reached 78.6%,the deviation from the 200 dma looks extreme and there is resistance from the midpoint of the Andrew's pitchfork.
Sunday, 25 April 2010
Saturday, 24 April 2010
Another diverging index
Goog
Dax - square of144


I am watching this Gann square on the Dax.It is basically 2 squares of 1440 ie 2880 points/288 days.In the first chart the mid point and ending point both called significant turns ie 144 and 288 days which suggests the market has vibrated to this cycle in the past.In the first chart the declining 45 degree diagonal defined the downtrend.In the second chart the rising 45 degree diagonal has defined the uptrend and was broken,(although we have managed to make a new high.)288 days may be another important turn.288 days is on Wednesday,although we should allow 1-2 days either side.
s&p - a long-term count


Here is a long-term wave count from David at www.tradeyourwayout.com,which has some good videos.Of course it is just a view and may turn out to be wrong but it is not inconsistent with the economic environment in my view,and indicates the high level of risk for late entrants to this party.Friday was another strong day and we have almost reached the 0.618% retracement at 1228.Put/call ratio and Vix continue to exhibit high levels of complacency.Some of the foreign markets such as China and France are exhibiting much weaker looking charts over the last few days ie negative divergence.
lumber gravestone doji


I posted on lumber very recently but the 2 lower charts are updates of the 10th March chart.After slightly exceeding the target area his week's action traced out a gravestone doji,despite good new home sales figures released yesterday. This should mark at least a short-term top,more likely an exhaustion top.
Friday, 23 April 2010
Apple


I posted on Apple on 27th Feb pointing out the similarity with the chart of Baidu,the Chinese search engine,which had already broken out.I even noticed the bullish engulf but allowed my overall caution on the stockmarket to override the signal.This is a good object lesson in the value of mechanical signals and keeping your emotions out of the analysis !
Wednesday, 21 April 2010
lumber
spx
Dow
Tuesday, 20 April 2010
Put/call chart

Here we can see the sell signal from the put/call ratio chart.On the index itself there is an evening doji star reversal pattern that would be confirmed by a close below Friday's low.Markets are very volatile and it is just possible that we push slightly higher to the fibonnaci (0.618%) retracement at 1228,although momentum does not support this.
(chart from Ron Walker at chartpatterntrader.com)
Monday, 19 April 2010
Monday


Just a couple of charts.Mining stocks were weak and the Antofagasta chart looks to have at least a short-term top.China tightening monetary policy was in the news.The Dow had a strong rebound but technology was weak.The horizontal line represents 360 degrees on the square of 9 at roughly 11130 as mentioned in an earlier post.
Sunday, 18 April 2010
Power of the first range


The rally from the March 2009 low has been difficult to analyse,with lots of overlapping waves,and for swing traders,several false sell signals.In Elliott parlance we have had a laboured corrective move (at least since the higher low in July 2009)
In this chart I have tried to show the power of the first range (1590 points)as a forecasting tool.6112 is 1590 pts measured from the first low (Jly 2009).100% and 50% of the first range are always important levels to watch. (6178 is 50% of this range as measured from the Feb 2010 low.) 6112 was a difficult target for the market to reach (in fact it fell short by 11 pts),not classic bull market behaviour.A strong bull market is characterised by higher lows and range expansion.We got a decent correction after the first attempt at 100% of the first range,but managed to post a higher low and have subsequently rallied above the 6112 level,in what looks like an exhaustive move.Not all European indexes have managed to managed to break the January high .
Thus the Dax is now sitting precariously above 2 important levels,6112 and 6178
Breaking these levels would suggest the trend may be reversing which would be confirmed by having a larger correction (ie range down) than previous corrections.717 pts is the largest correction so far.I have not mentioned time in this analysis,but time can also be brought into the equation.
Ideally this analysis should be done with the cash index rather than nearest future.
Saturday, 17 April 2010
Subscribe to:
Comments (Atom)


.jpg)


