.

It is well enough that people of the nation do not understand our banking and monetary system, for if they did, I believe there would be a revolution before tomorrow morning. Henry Ford


Those who surrender freedom for security will not have, nor do they deserve, either one. Benjamin Franklin
.


The idea that you know what is true is dangerous, for it keeps you imprisoned in the mind. It is when you do not know, that you are free to investigate. ~ Nisargadatta Maharaj


Sunday, 30 September 2012

NY coffee

The daily chart looks like a triangle and triangles are not normally the end of the move,which suggests more downside (ED's excepted)
However the weekly chart bears watching with regards to the Gann harmonics at 72 weeks,144 points.The square of 144 was used to succesfully call the high last year
The high was 309 so 154.5 is important support


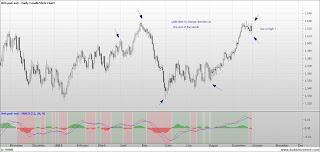


Cable


AAPL

Here is the square of 360 chart for AAPL.We reached the end of the square without hitting 720 and are below the red bull angle and the moving average and the important 7/8 line.We should have at least a decent correction now.There is negative divergence on the weekly macd although it has not crossed yet.The weekly chart has an evening star reversal  pattern following last week's doji which I highlighted.It needs to be confirmed by a close below last week's low.
Notice how there are similar Gann price/time harmonics as with the BKX chart and the S&P


Ron Walker hourly chart


Needs a trip to the lower bollinger band ?


Nice chart from Ron Walker


Watch next week to see if wedge support and the 34 dma can hold.Tuesday's black candle was a  sell signal
in line with what was discussed in last weekends post, where I wrote
 " Looks like an overthrow,the initial candle was a shooting star/inverted hammer,then 4 NR candles (narrow range) then a doji. Needs a black candle with a close below Thursdays low to suggest a reversal pattern. As Jeff Cooper teaches,the 7th day is often a reversal."
  So Tuesdays high is a reasonable invalidation point or stop-loss level for shorts


Saturday, 29 September 2012

BKX - Failure at end of yearly cycle

BKX ended the second square of 180,completing 360 degrees/18 point Gann harmonic with a 7 day  blow-off rally and rapid retreat back  below price resistance,leaving a Pinocchio bar,which is bearish price action


VEU


Ftse


Could be a mirror image foldback pattern (Michael Jenkins)  ?


another take on gold


Just a thought...


I lean to the view that a top may be in though .Maybe one of these 2 scenarios ? We need to keep an open mind and be patient.It could still rally and fulfil the criteria above,following such a correction


Friday, 28 September 2012

Ftse

Headed for support from the 8x1  and previous low ?


Soybeans

C wave now at prior 4th wave support


SPX


5 down,3 up ? bearish rising wedge


Thursday, 27 September 2012

Dax

another hit for Gann's "seasonal time" ?


Ftse - an attempt to count the sqiggles


Wednesday, 26 September 2012

Ftse wedge


 a very speculative wave count


Tuesday, 25 September 2012

Aud lower high looks very much confirmed now and my thinking is we could decline into the first week of October and that stocks could do the same


Monday, 24 September 2012

a nice example of Jeff Cooper's 7 day reversal rule ?

Square of  144 and next minor 1/8 level


CAC

bear flag breakdown following wedge breakdown ?


Sunday, 23 September 2012

http://slopeofhope.com/2012/09/the-four-macro-horsemen-of-the-apocalypse-evil-plan-850by-bdi.html?utm_source=feedburner&utm_medium=feed&utm_campaign=Feed%3A+typepad%2Ftradeblogs%2Fthe_slope_of_hope_with_ti+%28Slope+of+Hope+with+Tim+Knight%29
Dax future (Dec) with Gann angles and % resistance levels


chart from Astrocycles (Francis Bussiere)


he has some nice charts on his public list at Stockcharts. Check out this long term chart of crude. Looks very bearish with the 3 peaks pattern.Crude follows the square of 144


Andrea Calissano update   http://www.thewavetrading.com/2012/09/22/weekly-analysis-0922/#more-3461

Spx - overthrow,7 day reversal pattern ?


Looks like an overthrow,the initial candle was a shooting star/inverted hammer,then 4 NR candles (narrow range) then a doji. Needs a black candle with a close below Thursdays low to suggest a reversal pattern. As Jeff Cooper teaches,the 7th day is often a reversal.
 The high was 72 td so 90 td is the next obvious td pivot. Could that be a low ? That would be Oct 4 which is  also an important 1 year cycle date.Also possible we rally into that date (blowoff type move but that seems less likely given put/call ratio,Cobra's USHL5 chart etc)

Cobra's USHL5 chart :

http://www.zerohedge.com/news/2012-09-22/whats-next-simon-johnson-explains-doomsday-cycle

Saturday, 22 September 2012

Pretzel's put/call ratio chart

http://mediacdn.disqus.com/uploads/mediaembed/images/348/7759/original.jpg
This one's for Wags,everyone's favourite troll and I have to say its a great looking chart....now get off my back.Please.Thankyou....lol


http://btlplus.blogspot.com.ar/2012/09/dow-jones-transport-update_21.html


http://marketshadows.wordpress.com/2012/09/22/dow-theory-divergences/

nice post and charts from Springheel Jack

Gold

Looking at this chart the obvious call would be that we are at the top of a trading range.We had a bearish inverted hammer on Friday so could see some profit-taking. The 200dma is flat. We are 90 td from the May low. Gold often turns on seasonal time dates (equinox today)


If we have a pullback and rally again then watch closely because the weekly chart shows this would be a 3rd attempt at 1800 resistance and Gann's rule is that 3rd attempts usually succeed


DXY


cycles chart suggests the dollar could remain weak until late October,which could make life difficult for equity bears in the short term
Dax with major Murrey Math lines and Gann angles.Waiting for the 2x1 to break seems like a good sell strategy


Next week should be interesting. The bulls are arguing that the dollar is still weak (thanks to Bernanke) so that its still risk on (Nouf is making this point quite strongly for example) Here is  a Nzd chart from DarkestKnight to support this point


Against that the DJ Transports chart is suggesting serious weakness,and oil is sending negative signals.

AAPL

weekly doji at channel resistance


BKX

I posted this chart a long time ago and haven't looked at it for a while.Approaching the end of the square with increased volatility.The key is to watch how it performs once the square ends...ie does the 50 level remain resistance or can we start a new bull cycle ? The volatility is showing that quite a battle is going on at this key juncture of price and time


Friday, 21 September 2012

TRAN weekly chart looks like a break of triple bottom so we should get a fast move down.Volume was higher than normal.

The Fed's worthless balance sheet   http://www.jsmineset.com/2012/09/21/qe3-to-infinitythe-final-end-game/

Dax

Is the Dax wave count complete ? We pushed to 7480 today.To my mind anywhere near 7500 should be very strong resistance,if only for a pullback
I have marked Gann's seasonal turn dates (Equinox and solstice ) on the chart in red


http://www.zerohedge.com/news/jim-grant-we-are-now-all-labrats-bernanke-and-fourth-branch-government

Thursday, 20 September 2012

Ftse250 Square of the range

We have a 6 month (180 degree) time period from march 14 to sep 14 top and an 1800 point range


3 tops on the hourly and a LH


chart from "Bull and BearTrend Lines" (see blog list)